
GitHub Copilot Repository Metrics Dashboard: Track Agent Pull Requests, Code Reviews, and AI Credits
GitHub’s repository-level Copilot usage reports finally let admins see where coding agents and Copilot code review are changing pull request activity. This guide turns the new reports into a practical dashboard, weekly review routine, and AI credit governance system.

Quick Answer: What a Copilot Repository Metrics Dashboard Should Show
A GitHub Copilot repository metrics dashboard should answer one simple question: where is Copilot creating measurable engineering activity, and where is it just consuming AI budget without a clear workflow story? The new repository-level Copilot usage metrics API makes that question easier because it reports daily, per-repository pull request activity for Copilot coding agent and Copilot code review. Instead of seeing only enterprise totals, organization totals, or user-level usage, admins can now connect Copilot activity to the codebases where work actually happens.
The minimum useful dashboard has five blocks: repository activity, coding-agent pull requests, Copilot code review activity, user or team adoption, and AI credit guardrails. If you only track total AI credits, you will know whether spend is rising, but not whether the spend is tied to valuable work. If you only track pull requests, you will see activity, but not whether one team is draining the credit pool. The dashboard becomes useful when those signals sit next to each other.
ai_credits_used, add Copilot app activity from the 1-day or 28-day report, and review the top repositories by agent-created PRs, reviewed PRs, and week-over-week change.This cluster article supports our broader GitHub Copilot usage metrics API guide. The pillar explains the API and reporting landscape. This article goes narrower: how to design the actual dashboard an engineering manager, platform team, or AI tooling owner can use every week.
Why Repository-Level Copilot Metrics Matter Now
Until recently, most Copilot reporting conversations were stuck at the wrong level. Seat assignment told you who had access. User-level usage told you who was active. Enterprise or organization totals told you whether adoption was rising. Those reports are helpful, but they do not tell you which repositories are benefiting from Copilot coding agent or automated code review. A developer platform team needs that repository lens because engineering work is organized around services, apps, libraries, and ownership boundaries.
GitHub’s July 17 changelog announced repository-level Copilot usage metrics as generally available. The update added two endpoints that return a per-repository report for a single day: one under the enterprise scope and one under the organization scope. Each report focuses on pull request activity for Copilot coding agent and Copilot code review. That is a narrow feature, but it is powerful because pull requests are one of the few places where AI assistance becomes visible as engineering workflow rather than private editor behavior.
The timing also matters because Copilot billing and AI credit controls are becoming more important. GitHub’s usage metrics API now includes user-level AI credit usage, while billing documentation and budget controls emphasize that agent sessions can consume a disproportionate share of shared credit pools. GitHub also added AI credit pools for cost centers in the billing UI, making it easier for enterprises to align Copilot consumption with business units or internal budget owners. Together, these updates create a new operating model: measure the repository, understand the user, and govern the budget.
Search results around this topic are still thin. Official docs explain endpoints, and changelog posts explain what changed, but admins still need the practical middle layer: which fields should go on a dashboard, which ratios are useful, which caveats matter, and how often to review the results. That is the content gap this article fills.
The Metrics Your Dashboard Should Track First
Do not start by collecting every possible Copilot field. A dashboard that tries to include every endpoint on day one usually becomes a reporting museum: impressive, busy, and rarely used. Start with the fields that help someone make a decision. For Copilot repository reporting, the first decision is whether an AI-assisted repository workflow is healthy, underused, overused, blocked, or worth expanding.
The repository report is especially useful for work that leaves a pull request trail. Copilot coding agent can create pull requests, and Copilot code review can review pull requests with suggestion counts broken down by comment type. Those are concrete workflow events. They are easier to discuss than vague claims like “AI made us faster.” A platform lead can ask: which service saw agent-created PRs, did those PRs merge, did review suggestions concentrate in risky areas, and did the credit usage look reasonable for the outcome?
There is an important limitation: user-level ai_credits_used is an overall per-user total. GitHub’s changelog notes that it is not currently broken down by feature, model, or surface. That means you should not claim exact repository-level AI credit cost unless your own internal data can support the attribution. Treat repository-level pull request metrics and user-level credit usage as related signals, not a perfect ledger.
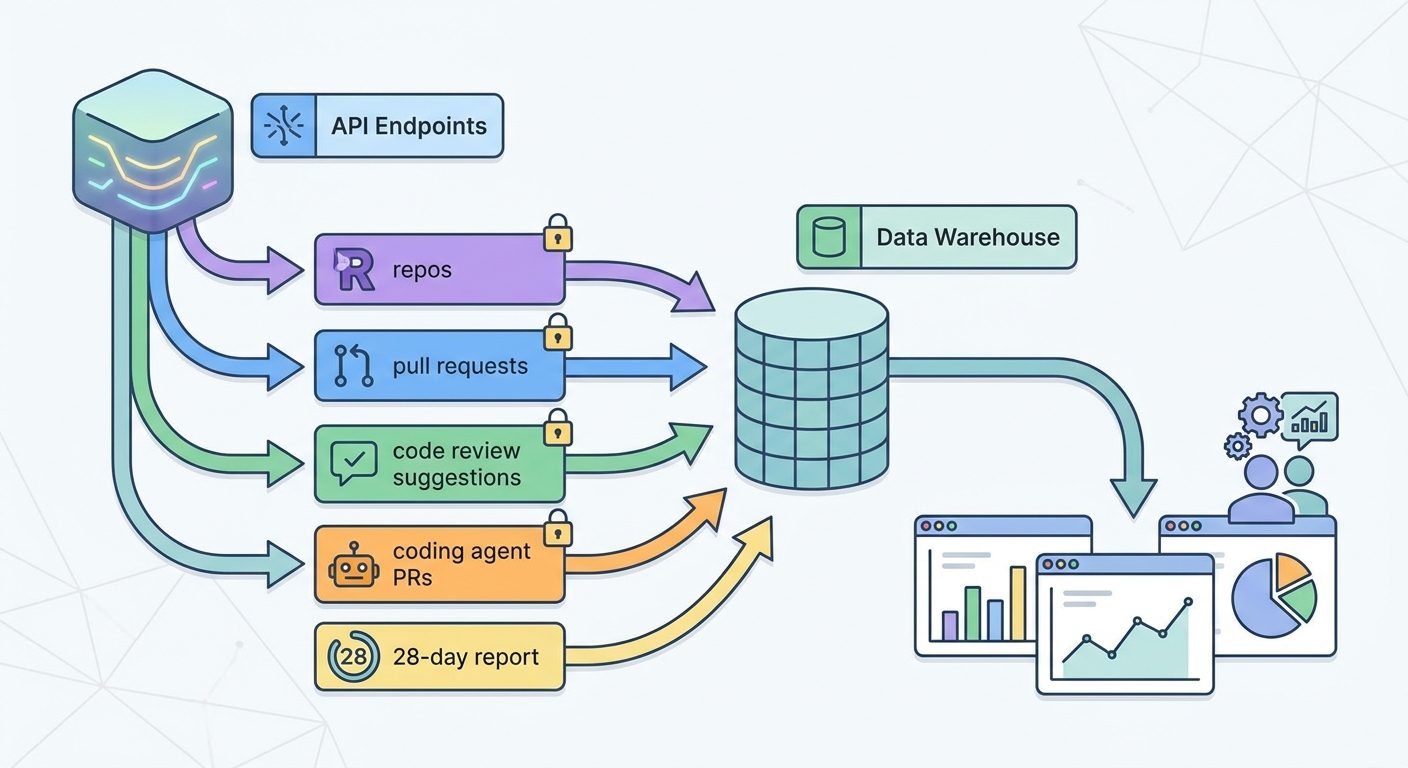
A Simple Architecture for Copilot Repository Reporting
The cleanest architecture is boring in the best way. Pull the daily reports, store raw files, normalize them into a small metrics table, join with repository metadata, and publish a dashboard that updates on a predictable schedule. The goal is not to build a perfect analytics platform. The goal is to create a weekly operating view that engineering leaders trust.
- Enable the Copilot usage metrics policy. GitHub documentation says the policy must be enabled everywhere for the enterprise to support these endpoints. Make sure the team pulling reports has the required role or custom permission.
- Choose enterprise or organization scope. Enterprise scope is better for central AI governance. Organization scope is better when a single engineering org owns its own reporting process.
- Pull daily repository reports. Use the
repos-1-dayendpoint for the target day. The report covers a complete day for which data has been processed. - Store raw downloads. Keep the original report files in object storage or a controlled analytics bucket. Raw retention makes later audits easier.
- Normalize into analytics tables. Create tables for repository metrics, user metrics, app metrics, and budget or cost-center metadata.
- Join with repository ownership. Add team, service tier, production criticality, language, repo age, and business unit where available.
- Publish a weekly dashboard. Show top movers, outliers, and action items instead of only charts.
A practical schema might include report_day, repository_id, repository_name, organization, coding_agent_prs_created, coding_agent_prs_merged, code_review_prs_reviewed, code_review_suggestions, team_owner, service_tier, and review_notes. If the API response structure changes, keep your ingestion layer flexible and version the parser.
For the user side, collect ai_credits_used, daily active users, and any available feature totals from enterprise or organization reports. For Copilot app usage, GitHub’s July 17 update added daily_active_copilot_app_users and a dedicated totals_by_copilot_app section with session count, request count, prompt count, and token usage fields. Keep app usage separate from IDE, language, model, and lines-of-code metrics because GitHub intentionally reports it in its own section.
Dashboard KPI Blueprint: What to Put on the First Page
The first page should be built for a 10-minute weekly meeting. If the dashboard requires an analyst to explain every chart, it is too complicated. Use a short scorecard, then let people drill down into details only when something looks unusual.
| Dashboard block | Metric | Why it matters | Action if abnormal |
|---|---|---|---|
| Repository adoption | Active repositories with Copilot PR or review activity | Shows where AI-assisted workflow is actually happening. | Compare with expected pilot repos and onboarding plans. |
| Coding agent output | Agent-created PRs and merged agent PRs | Separates experimentation from accepted code changes. | Review merge quality, rollback rate, and agent instructions. |
| Code review usage | Reviewed PRs and suggestion volume | Shows whether Copilot review is used as a safety net or noise generator. | Check rules, repo configuration, and developer feedback. |
| Credit signal | User-level AI credits used near active repos | Highlights heavy usage patterns that need context. | Ask whether high usage maps to high-value work or repeated loops. |
| App adoption | Daily active Copilot app users, sessions, prompts, token usage | Shows whether teams are shifting from IDE-only use to app-based workflows. | Train teams, update policies, or investigate unexpected spikes. |
| Budget posture | Cost center pool status and budget alerts | Keeps AI usage aligned with internal ownership. | Adjust budget controls or clarify who can approve overages. |
A useful dashboard also needs context fields that are not from the Copilot API. Repository ownership matters. Service criticality matters. Team size matters. A repository with three agent-created PRs might be a breakthrough for a low-activity internal tool, but noise for a high-velocity platform repo. A dashboard that ignores repository context will encourage bad comparisons.
Use badges or tags to keep the story readable: pilot repoproduction criticalhigh credit signalreview spikeneeds enablement. These simple labels help non-analysts understand what to do next.
The Weekly Review Workflow for Engineering Managers
The dashboard is only useful if it changes behavior. Create a weekly loop with a clear owner, a short agenda, and a small number of decisions. The owner might be a developer productivity lead, platform engineering manager, AI enablement team, or FinOps partner. The meeting should not become a generic AI status update. It should focus on repository-level signals and the decisions they imply.
Monday: Pull reports and check freshness
Confirm that the latest complete day or 28-day report is available. Store the raw report, validate the schema, and run basic checks: row count, active repositories, missing values, and API errors. If a report returns no content, record that explicitly rather than silently showing yesterday’s data.
Tuesday: Review repository outliers
Look for repositories with unusual changes: sudden code review spikes, many agent-created PRs, high suggestion volume, or new activity in a sensitive service. The goal is not to punish usage. The goal is to understand whether the workflow is healthy. High Copilot activity can be good when it maps to migrations, tests, or repetitive maintenance.
Wednesday: Compare credits and outcomes
Review user-level AI credits and budget status next to repository activity. Ask three questions: who used the most credits, what work was happening in their repositories, and did the output justify the usage? Because user credits are not feature-level or repo-level billing totals, phrase findings carefully. Use the signal to start a conversation, not to produce an invoice.
Thursday: Improve instructions and policies
If agent PRs are noisy, improve repository instructions, issue templates, test commands, or allowed workflows. If code review suggestions are too broad, adjust configuration. If a team has low adoption but high potential, schedule training. Governance should help developers, not surprise them with restrictions after the fact.
Friday: Share one takeaway
Publish a short internal note: one win, one risk, and one change for next week. For example: “Copilot code review caught repeated test issues in the payments repo; agent PRs in the docs repo merged cleanly; we are adding a budget checkpoint for long-running migration tasks.” A small weekly narrative builds trust faster than a giant dashboard nobody reads.
How AI Credits, Cost Centers, and Repository Metrics Fit Together
GitHub’s budget documentation is blunt about the risk: under usage-based billing, included AI credits are pooled and shared across licensed users, and a single heavy user or automated agent session can consume a disproportionate share early in the billing cycle. That is why repository metrics should not live in a separate engineering dashboard with no billing context. AI coding is now partly a developer productivity issue and partly an AI FinOps issue.
The July 20 changelog update for AI credit pools adds another important piece. Copilot Business and Copilot Enterprise customers on GitHub Enterprise Cloud can manage a cost center’s AI credit pool directly in the billing UI. GitHub automatically calculates the pool limit from assigned licenses, and admins can choose what happens at the limit: block further included usage or allow additional spend if the enterprise permits overages. That means cost-center ownership can become visible in the same operating model as repository ownership.

Here is the practical way to connect them. Map each repository to a team or cost center where possible. Review repository-level Copilot activity for that ownership group. Compare it with user-level AI credit signals for members of the same group. Then review the cost center’s pool and budget posture. The result is not perfect attribution, but it is enough for governance conversations: which group is adopting agents, which repos are receiving automated review, and which budget guardrails need tuning?
Healthy budget behavior
- Teams understand when agent usage is encouraged.
- Budgets are set before large rollouts, not after surprises.
- Repository owners can explain spikes with project context.
- Power users get overrides when their work clearly needs more capacity.
Risky budget behavior
- Admins track only total spend and ignore repository outcomes.
- Developers avoid useful agents because budget rules feel punitive.
- Cost centers are configured without mapping repos to ownership.
- Long-running agent sessions happen without checkpoints.
For a deeper pricing and budget background, pair this article with our guide to reducing GitHub Copilot AI Credits and the Copilot AI Credits calculator. Those posts focus on usage habits. This one focuses on repository reporting.
Common Mistakes When Building a Copilot Metrics Dashboard
Mistake 1: Treating every AI credit as waste
High usage is not automatically bad. A migration, security remediation, documentation cleanup, or test expansion can be exactly the kind of work where Copilot agents are worth using. The question is whether the usage produced useful output and whether the team had guardrails.
Mistake 2: Treating every agent PR as productivity
An agent-created pull request is not a win until it is reviewed, tested, and merged safely. Track accepted outcomes, not only generated activity. If agent PRs are repeatedly rewritten by humans, the dashboard should surface that as an instruction-quality problem.
Mistake 3: Mixing app usage, IDE usage, and review usage into one blob
GitHub reports Copilot app usage in its own section for a reason. Keep it separate. The app may support a different workflow than in-editor completion or pull request review. Combining every surface into one chart hides adoption patterns.
Mistake 4: Ignoring permissions
The API is not available to every developer by default. Enterprise owners, billing managers, organization owners, and authorized custom roles can access reports depending on scope and permission. Build the dashboard with least privilege and document who can see what.
Mistake 5: Forgetting the human review step
Repository-level metrics can tell you where Copilot acted, but not whether the code is appropriate for your architecture, customers, or compliance obligations. Keep human code review, test gates, and security rules in the loop.
A Lightweight Implementation Plan
If you are starting from zero, use this four-week implementation plan instead of trying to build the final system immediately.
| Week | Goal | Deliverable |
|---|---|---|
| Week 1 | Prove data access | Pull one enterprise or organization repository report and store the raw output. |
| Week 2 | Add context | Join repository rows with owner, service tier, and team metadata. |
| Week 3 | Add credit signals | Place user-level AI credit usage and Copilot app usage near repository activity. |
| Week 4 | Create operating cadence | Publish a weekly scorecard with outliers, wins, risks, and one governance change. |
This sequence keeps the project practical. You get a dashboard quickly, but you also protect against two common traps: launching a beautiful chart without trusted data, or building a data warehouse before anyone has agreed what decision the report should support.
Three Example Dashboard Readouts
To make the dashboard concrete, imagine three very different weekly readouts. In the first, a platform repository shows a rise in Copilot code review suggestions, but almost no agent-created pull requests. That usually means developers are using Copilot as a second reviewer rather than a coding delegate. The right action is not budget restriction. It is to check whether the suggestions are useful, whether they repeat the same style issue, and whether repository review rules should be tuned.
In the second readout, an internal tools repository has several agent-created pull requests and a high merge rate. AI credit usage also rose among two maintainers, but the work maps to a planned maintenance sprint. That is a healthy pattern. The team should document the prompt pattern, repository instructions, and test commands that made the agent successful, then reuse that playbook for similar low-risk maintenance work.
In the third readout, a production service shows a sudden spike in user AI credits, but repository reports show little merged pull request activity. That does not prove waste, because the credits may have gone to design, debugging, or app usage. It does mean the manager should ask for context before the pattern repeats. The best response is a calm workflow check: what task was attempted, was the scope too broad, did the agent loop, and would a smaller plan-first prompt have produced the same outcome with less usage?
These examples show why repository metrics are most useful as a conversation starter. They turn AI usage from a private developer habit into an observable engineering workflow. The point is not to micromanage every prompt. The point is to notice when AI assistance is creating durable code-review value, when it needs better instructions, and when budget controls should be adjusted before frustration spreads.
Keep Learning on AI Feature Drop
- GitHub Copilot Usage Metrics API Guide — the broader pillar article for API reports, AI credits, app metrics, and governance.
- How to Reduce GitHub Copilot AI Credits — practical habits for limiting unnecessary consumption.
- GitHub Copilot AI Credits Calculator — estimate workflow risk before large agent sessions.
- GitHub Copilot App Guide — understand app-based agent workflows that now appear in usage metrics.
- GitHub Copilot Agent Finder Explained — related agent discovery and workflow coverage.
- GitHub Agentic Workflows Guide — governance ideas for GitHub token and agent workflows.
Sources and References
- GitHub Changelog: Repository-level GitHub Copilot usage metrics generally available
- GitHub Docs: REST API endpoints for Copilot usage metrics
- GitHub Changelog: AI credits consumed per user in the Copilot usage metrics API
- GitHub Changelog: GitHub Copilot app now available in the usage metrics API
- GitHub Changelog: AI credit pools for cost centers in the billing UI
- GitHub Docs: Getting started with budget controls
GitHub reporting fields, permissions, and billing controls can change. Verify your active enterprise policy, API version, role permissions, and billing dashboard before making purchasing or governance decisions.
FAQ: GitHub Copilot Repository Metrics Dashboard
What is a GitHub Copilot repository metrics dashboard?
It is a dashboard that uses Copilot usage metrics API reports to show where Copilot coding agent and Copilot code review are creating repository-level pull request activity, then compares those signals with adoption and AI credit guardrails.
Which API endpoint should I use for repository-level Copilot metrics?
GitHub documents repository reports under enterprise and organization scopes using the repos-1-day report. The endpoint returns download links for a per-repository report for a specific day.
Can I calculate exact AI credits per repository?
Not from the public user-level AI credit field alone. GitHub’s changelog says ai_credits_used is an overall per-user total and is not broken down by feature, model, or surface. Use it as a related signal unless you have stronger internal attribution.
Who can access Copilot usage metrics reports?
Access depends on scope and permissions. GitHub documentation references enterprise owners, billing managers, organization owners, and custom roles with the required View Copilot Metrics permission. The Copilot usage metrics policy must also be enabled.
What should engineering managers review each week?
Review active repositories, agent-created PRs, merged agent PRs, code review volume, suggestion spikes, user AI credit signals, Copilot app adoption, and budget or cost-center status.
How do cost centers relate to repository metrics?
Cost centers help map AI credit ownership to internal groups. If repositories are mapped to teams or cost centers, admins can compare Copilot activity with the pool and budget posture of the group that owns the work.
Should high Copilot usage be restricted?
Not automatically. High usage can be healthy when it maps to valuable migrations, tests, or review workflows. Restrict or tune usage when it is vague, repetitive, unaudited, or disconnected from useful output.
How is this different from the broader Copilot usage metrics API guide?
The broader guide explains the reporting landscape. This cluster article focuses specifically on designing a repository-level dashboard and weekly operating process for engineering teams.
Post a Comment