
GitHub Copilot Browser Tools Guide: Test Web Apps Inside VS Code With Agentic Browsing
GitHub Copilot browser tools give VS Code agents a real browser they can use to test web apps, inspect page state, capture screenshots, and loop back into code fixes. This guide explains what changed, how to use the workflow safely, and where it fits in a credit-aware development routine.
GitHub Copilot Browser Tools: Quick Answer
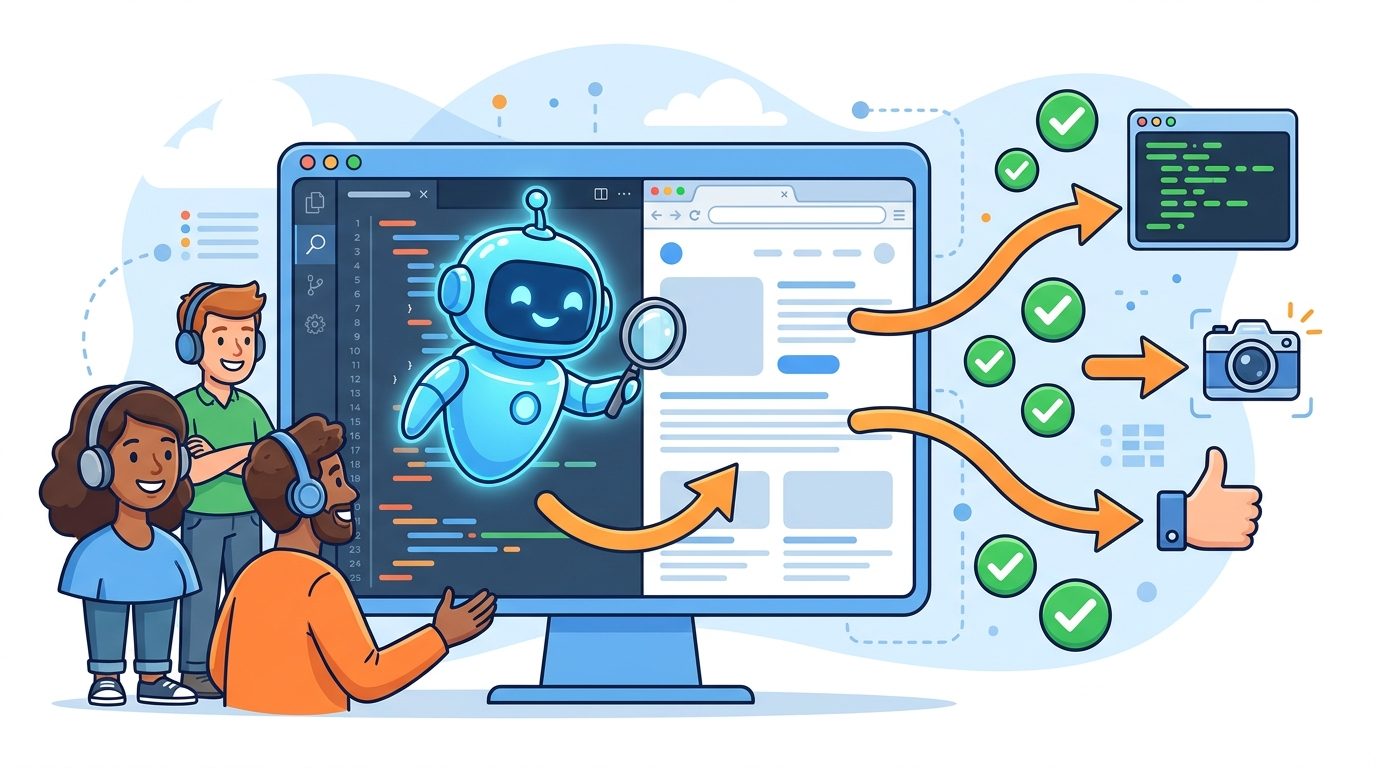
GitHub Copilot browser tools are built-in VS Code agent capabilities that let Copilot open and control pages in the integrated browser. Instead of only reading source files and guessing whether a button, form, route, or layout works, the agent can open the app, click through it, read the visible page, inspect console errors, capture screenshots, and use that feedback to suggest or make fixes.
The useful mental model is simple: Copilot is no longer limited to static code review. For front-end and full-stack work, it can move through a browser loop that looks closer to how a developer verifies a change. It can load a localhost app, try a checkout flow, submit a form, check whether the UI broke, notice JavaScript errors, and return to the code with evidence.
This does not mean you should hand over every browser task to an agent. The best results come from scoping the task, giving the agent a narrow user journey, reviewing the changes, and keeping sensitive tabs or production accounts out of reach unless you deliberately share them. Browser tools are powerful because they bring runtime feedback into the coding loop; they are safest when you treat that runtime access as intentional, observable, and reversible.
What Changed: A Real Browser Inside the Copilot Agent Loop
GitHub announced that browser tools for GitHub Copilot in VS Code are generally available. The official changelog says agents can drive a real browser, navigate live web apps, and feed what they find back into chat. The broader VS Code June release notes also highlight integrated browser improvements, parallel agent sessions, clearer cost visibility, Marketplace model discovery, and Autopilot improvements. Put together, these updates move VS Code further toward an agentic development environment rather than a chat box attached to an editor.
Before this kind of workflow, a coding assistant could inspect files, infer likely problems, and produce suggestions. That helped, but it was often blind to runtime behavior. A React component might look fine but fail after hydration. A route might compile but redirect incorrectly. A CSS change might pass tests but overlap a mobile button. A login flow might break only after a modal, toast, or third-party redirect appears. Browser tools reduce that gap by letting the agent observe the app as a user would.
According to the VS Code docs, the integrated browser can be opened directly inside the editor and used for previewing applications, testing authentication flows, and selecting page elements as chat context. The browser-agent testing guide lists concrete tool categories: page navigation, page reading, screenshots, interactions such as click and type, dialog handling, and custom browser automation. That is the stack developers need for a closed build-test-fix loop.
For AI Feature Drop, this topic is a strong Microsoft pillar because GA4 data shows that developer AI workflow content is currently the site’s clearest organic pull. During the latest complete 28-day window, OpenAI Codex and Copilot credit-control pages were among the highest-performing posts. Search Console returned no query rows for the window, so the topic was selected from GA4 page behavior, category rotation, article history, and live official documentation rather than unsupported keyword claims.
How Copilot Browser Tools Work in VS Code
Browser tools sit inside the agent workflow. You ask Copilot to perform a task, and if browser tools are enabled and relevant, the agent can open a browser page, navigate to a local or remote app, read the page, interact with elements, capture a screenshot, inspect errors, and use that evidence in the next step. The important phrase is “in the next step.” Browser access is not a separate novelty; it becomes feedback for coding decisions.
That workflow matters most when a feature has multiple moving parts: UI state, data fetching, client-side routing, validation messages, responsive layout, and browser-specific behavior. A code-only assistant may tell you that the implementation is plausible. A browser-enabled agent can say the form submit button remained disabled after entering valid data, the console showed a missing import, or the success toast appeared behind the modal overlay.
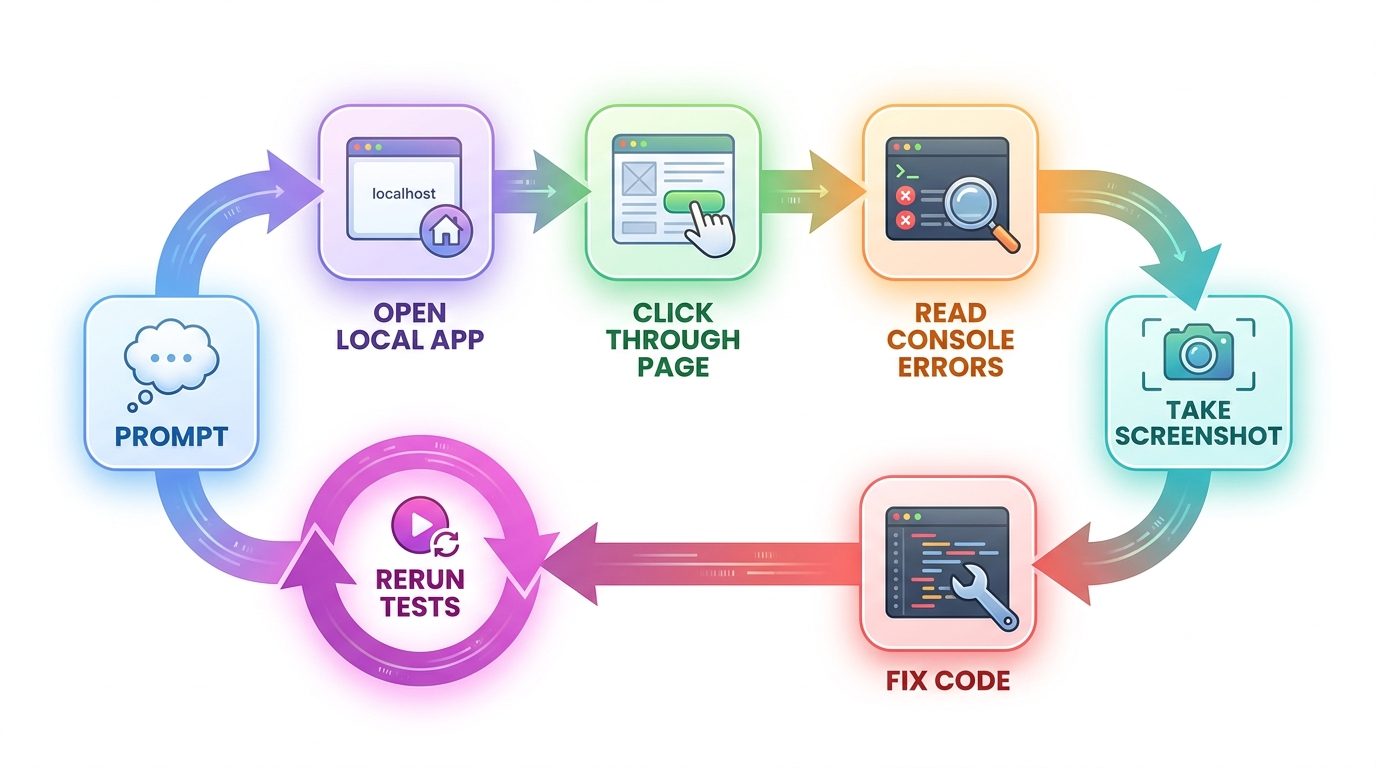
The most useful habit is to ask the agent for evidence. Instead of saying “fix the checkout page,” say: “Open the checkout page, test adding one item, entering a valid email, and submitting the form. Report the exact step that fails, the console errors, and the smallest code change needed.” That prompt turns browser tools into a verification loop instead of a wandering agent session.
How to Set Up GitHub Copilot Browser Tools
The setup is intentionally lightweight, but a few details matter. You need VS Code, an active GitHub Copilot subscription, and browser tools enabled for the agent. The VS Code browser testing guide points users to the workbench.browser.enableChatTools setting and the chat tools picker. In the chat UI, browser tools are grouped under built-in tools, and the guide recommends verifying that they are enabled before asking the agent to test a page.
Step 1: Update VS Code
Because the generally available browser-tools experience landed in the recent VS Code release wave, update VS Code before troubleshooting missing controls. The June release coverage spans several versions, and browser behavior may differ if you are on an older build, an enterprise-managed build, or a machine where your organization has disabled agent tools.
Step 2: Open the right workspace
Open the project you want Copilot to work on. Keep the scope tight. If your bug lives in one app package inside a monorepo, open that workspace or tell the agent exactly which app and route to inspect. Large context windows and broad workspaces can produce slower, more expensive, and less reliable sessions.
Step 3: Enable browser tools
In the Chat view, choose the agent mode you want to use, open the tools picker, and confirm the browser tools are enabled. If you do not see them, check the VS Code setting, your Copilot plan, and any organization policies. Enterprise users should also check whether browser tools or network access are managed centrally.
Step 4: Start with a narrow task
Ask for one user journey first. A good first prompt is not “test my whole app.” Try: “Open the local app, go to /pricing, switch from monthly to annual billing, verify the price cards update, and report any console errors without editing code yet.” This gives the agent a measurable route and keeps you in control before edits begin.
Step 5: Review before keeping changes
After the agent proposes edits, inspect the diff, run your normal tests, and decide whether to keep the change. Browser verification is useful evidence, not a replacement for code review, accessibility checks, security review, or product judgment.
A Practical Browser-Testing Workflow for Developers
The best Copilot browser-tools workflow has five stages: define, observe, diagnose, change, and verify. Skipping stages is what turns helpful agents into expensive guessers. When you make the loop explicit, the agent has a target and you have checkpoints.
| Stage | What you ask Copilot to do | Human checkpoint |
|---|---|---|
| Define | Describe the page, route, user flow, and expected result. | Make sure the task is small enough to verify. |
| Observe | Open the page, interact with it, capture errors, and summarize evidence. | Confirm the agent is testing the right thing. |
| Diagnose | Explain the likely cause before changing files. | Reject vague guesses or broad rewrites. |
| Change | Apply the smallest code change that addresses the evidence. | Review the diff and preserve product intent. |
| Verify | Reload the page and repeat the same flow. | Run tests and decide whether to keep the patch. |
For example, imagine a settings page where users can update notification preferences. A weak prompt says, “Fix settings.” A strong prompt says, “Run the local app, open /settings/notifications, toggle email notifications off and on, save, reload, and verify that the saved state persists. If it fails, report the console error and inspect only the settings component, notification API helper, and save handler before editing.” The strong prompt saves time because it narrows the browser path, relevant files, and success condition.
Browser tools are also valuable for visual regressions. You can ask the agent to inspect a page at desktop and mobile widths, capture screenshots, and identify whether a layout problem is caused by CSS, markup order, or missing responsive classes. You should still review the visual result yourself, especially for brand-sensitive pages, but an agent can quickly catch broken spacing, hidden buttons, and obvious overflow.
Another good use case is console-driven debugging. Many web bugs do not need speculation; they need someone to read the browser console, identify the first meaningful error, trace it back to the source file, and test the fix. Copilot browser tools can close that loop faster than a chat-only interaction where you manually paste errors back and forth.
Privacy, Permissions, and Enterprise Controls
The most important safety detail is that VS Code distinguishes between your tabs and the agent’s tabs. GitHub’s changelog says your tabs are private by default: the agent cannot read or interact with a page you opened unless you select Share with Agent, and you can revoke access. Pages the agent opens itself use isolated sessions with no access to the cookies or storage from your everyday browsing. Parallel agents also keep their browser tabs private from one another.
That design matters. It means browser tools are not a blanket permission for Copilot to inspect your personal browser. The agent gets access to the browser context you deliberately involve in the task. Sensitive permissions such as camera, microphone, location, notifications, and clipboard reads require explicit user approval for a site; agents cannot approve them on your behalf. Low-risk actions such as sanitized clipboard writes may be allowed by default, but anything sensitive should be treated carefully.
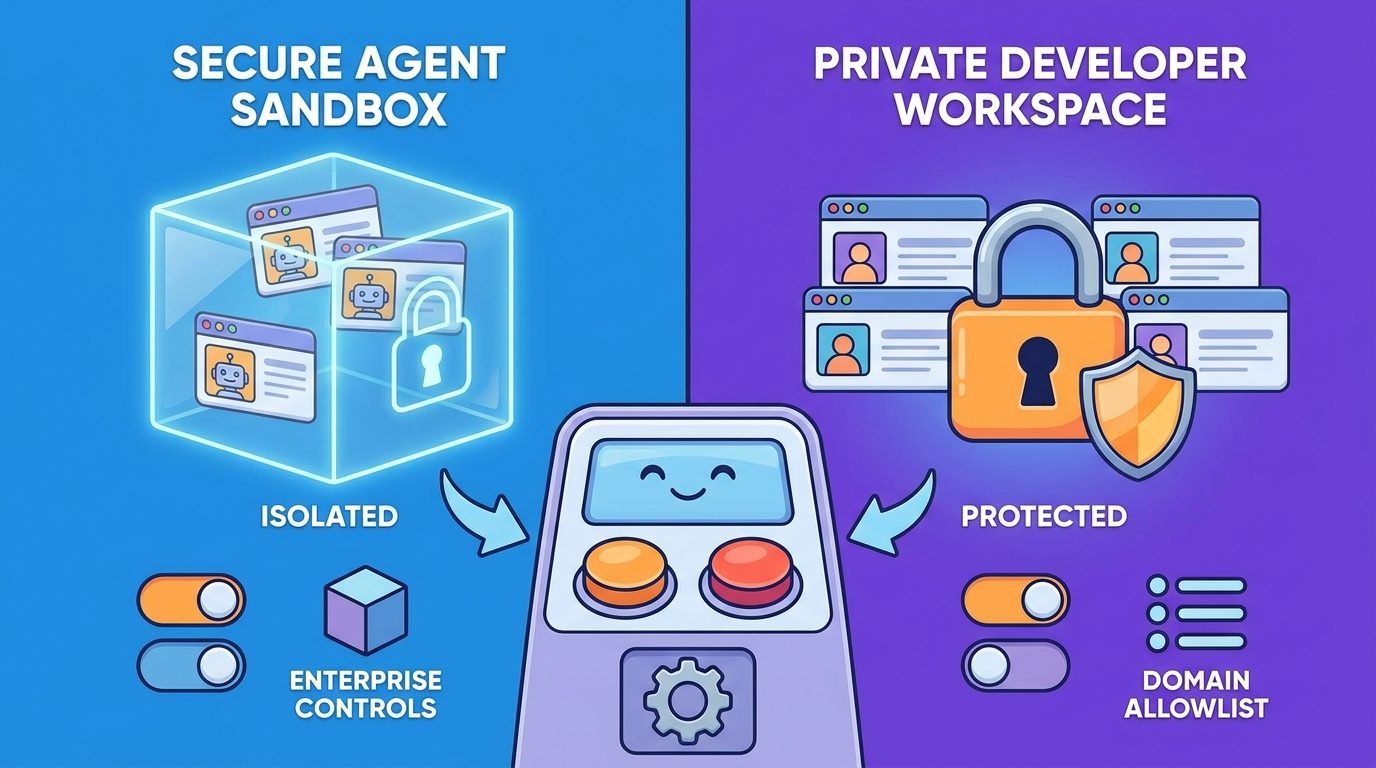
Enterprise administrators have additional controls. The GitHub changelog lists a dedicated on/off switch, workbench.browser.enableChatTools, plus agent network domain controls such as allowed and denied domain lists. Denied domains take precedence, and wildcard rules can restrict which sites agents and the integrated browser can reach. Workspace trust and approval prompts still apply.
What feels safer
- Agent-opened tabs are isolated from your regular browser storage.
- User-opened tabs are private until deliberately shared.
- Sensitive browser permissions remain under human control.
- Teams can restrict domains and disable browser tools centrally.
What still needs judgment
- An agent can still make bad product or code decisions if the task is vague.
- Staging data can still be sensitive if it mirrors production.
- Browser validation can miss accessibility, security, and edge-case issues.
- Long sessions can consume credits if they wander through broad flows.
How Browser Tools Affect AI Credits and Cost Visibility
Browser tools are useful, but they can make sessions longer. The agent may inspect files, open pages, click through flows, collect evidence, edit code, and retest. That is exactly why the workflow is powerful, and exactly why developers should stay credit-aware. A small browser check can save time; an undefined “test everything” prompt can become a long agent session with unclear value.
Recent VS Code release notes also mention clearer cost visibility across whole sessions, delegated work, and subagent sections. That matters because browser testing can involve multiple steps hidden inside one high-level request. If your plan or organization tracks AI credits, look at session-level cost after agentic browser runs, not just the number of prompts you typed.
To control credits, split browser tasks by journey. Run one flow, review evidence, then decide whether another pass is worth it. Ask the agent to stop after diagnosis before editing. Require the smallest fix. Avoid asking it to browse the whole app unless you have a checklist. And if a browser run fails twice for unclear reasons, pause and debug manually instead of burning cycles on repeated “try again” prompts.
For more credit-control habits, see our GitHub Copilot AI Credits guide, Copilot credit reduction checklist, and Copilot usage metrics API guide.
Practical Examples: When to Use Copilot Browser Tools
Example 1: Debug a broken form
You changed a form component and users report that submit no longer works. Ask Copilot to open the form, enter valid data, submit it, check the console, and stop after reporting the failure. If the evidence is clear, let it inspect the form state, validation function, and submit handler. This is a strong fit because the browser proves whether the user flow works.
Example 2: Verify a route after a refactor
You moved routes or layouts in a Next.js, Remix, SvelteKit, or similar app. Ask the agent to open the affected route, navigate to two linked pages, and report broken links or client-side errors. Keep the task narrow. Do not ask it to map the whole app unless you are intentionally running a broader QA pass.
Example 3: Catch visual regressions
Ask the agent to view a page at a desktop width and a mobile width, capture screenshots, and identify obvious layout issues. This is helpful for early triage, especially when a change affects nav bars, cards, modals, or sidebars. For final design approval, a human should still inspect the result.
Example 4: Test a login-adjacent flow with a safe account
Browser tools can be useful for auth flows, but use a test account, local auth emulator, or staging environment. Share only the page needed for the task. Do not let an agent explore production admin areas or accounts containing private customer data.
Example 5: Reproduce a console error from a bug report
If a bug report includes steps, turn those steps into the prompt. Ask the agent to reproduce the issue in the browser, capture the first meaningful console error, explain likely cause, and propose a minimal fix. This avoids the common failure mode where an AI assistant edits code without first confirming the bug.
Browser Tools vs Playwright Tests vs Manual QA
Copilot browser tools do not replace formal end-to-end tests. They sit between manual exploratory testing and scripted automation. They are faster to start than writing a full Playwright suite, but less durable than a committed test. They are more evidence-based than chat-only debugging, but less accountable than CI. Use each tool for the right job.
| Approach | Best for | Weak spot |
|---|---|---|
| Copilot browser tools | Fast exploratory validation, bug reproduction, UI debugging, agentic fix loops. | Not permanent unless you convert findings into tests. |
| Playwright or Cypress tests | Repeatable regression coverage in CI. | Takes more setup and maintenance. |
| Manual QA | Product judgment, edge cases, accessibility feel, visual polish, risky releases. | Slower and hard to scale without process. |
| Static code review | Architecture, security, maintainability, intent. | May miss runtime browser behavior. |
A smart workflow is to use browser tools for discovery, then turn repeatable bugs into tests. If Copilot finds that the pricing toggle fails after annual billing is selected, ask it to write a focused test after the fix. That way the agentic browser session creates durable value instead of becoming a one-time repair.
Why This Article Angle Was Chosen
The selected category was Microsoft because the previous generated article category was GoogleAI and the site rotation requires the next category in the fixed sequence. Within Microsoft, the topic was selected because recent GitHub and VS Code updates created a cluster of practical Copilot agent features, while AIFeatureDrop analytics show stronger engagement around coding-agent guidance, credit controls, and developer workflow explainers.
The article history already includes Copilot AI credits, Copilot app sessions, the usage metrics API, agent tasks, and broad GitHub agentic workflows. A new article about browser tools avoids repeating those topics because it focuses on web-app runtime validation inside VS Code: how agents open pages, interact with UI, inspect errors, capture screenshots, and stay inside privacy and enterprise controls. That is a distinct search intent and a useful internal-link hub for future cluster articles on browser testing prompts, enterprise controls, and converting agent findings into Playwright tests.
Final Recommendation: Use Browser Tools as a Verification Loop, Not a Magic Autopilot
GitHub Copilot browser tools are one of the clearest examples of where AI coding assistants are heading. The assistant is no longer just reading your code; it can observe the running product and bring that evidence back into the edit loop. For web developers, that is a meaningful upgrade.
The winning habit is discipline. Give the agent one flow. Ask for evidence. Let it diagnose before editing. Review the diff. Retest the exact flow. Convert repeatable failures into automated tests. Keep sensitive sessions isolated. Monitor session cost when tasks get long. If you do that, browser tools can save time without turning your editor into an unsupervised automation box.
For most teams, the best starting point is a low-risk local app flow: a form, route, modal, or responsive layout check. Once the team trusts the workflow, document prompt patterns, domain rules, staging account rules, and credit checkpoints. Browser tools are not just another Copilot feature; they are a new place where development, QA, security, and cost control meet.
Keep Learning on AI Feature Drop
- GitHub Copilot AI Credits Explained — understand how advanced Copilot workflows connect to credit usage.
- How to Reduce GitHub Copilot AI Credits — practical habits for scoped prompts, smaller context, and fewer wasted loops.
- GitHub Copilot App Guide — manage agent sessions, mobile fixes, and AI-credit-aware work.
- GitHub Copilot Usage Metrics API Guide — track adoption, repositories, and credit visibility for teams.
- GitHub Agentic Workflows Explained — broader setup, security, billing, and automation ideas.
Sources and References
- GitHub Changelog: Browser tools for GitHub Copilot in VS Code are generally available
- GitHub Changelog: GitHub Copilot in Visual Studio Code, June releases
- VS Code Docs: Integrated browser and browser tools for agents
- VS Code Docs: Build and test web apps with browser agent tools
- VS Code Docs: Use the Agents window
Feature availability, settings, and organization policies can change. Verify your active VS Code build, Copilot plan, and enterprise configuration before relying on browser tools in production workflows.
FAQ: GitHub Copilot Browser Tools in VS Code
What are GitHub Copilot browser tools?
They are VS Code agent tools that let GitHub Copilot open and control pages in the integrated browser, read page state, capture screenshots, inspect console errors, and use that feedback while coding.
Are Copilot browser tools generally available?
GitHub announced browser tools for GitHub Copilot in VS Code as generally available on July 1. Availability can still depend on your VS Code version, Copilot plan, and organization policies.
Can Copilot read my normal browser tabs?
No, not by default. GitHub says your tabs are private until you choose to share a page with the agent. Agent-opened tabs run in isolated sessions without access to your everyday browser cookies or storage.
What can the agent do in the browser?
It can navigate pages, click, type, hover, drag, handle dialogs, read page content, capture screenshots, inspect console errors, and use scripted browser flows when efficient.
Do browser tools replace Playwright tests?
No. They are excellent for exploratory validation and bug reproduction, but durable regressions should still become automated tests in tools such as Playwright or Cypress.
How do I reduce credit usage with browser tools?
Scope one user flow at a time, ask the agent to diagnose before editing, limit retest loops, avoid broad “test everything” prompts, and monitor session-level cost for longer agentic runs.
Can enterprises disable or restrict browser tools?
Yes. VS Code and GitHub documentation describe settings and policies for enabling or disabling browser tools and controlling which domains agents can reach.
What is the best first task to try?
Pick a local or staging web-app flow with low risk: a form submission, route check, modal interaction, or responsive layout inspection. Avoid production admin pages and sensitive accounts.
Post a Comment