
GitHub Copilot Localhost Testing Guide: Use Browser Tools to Catch Web App Bugs in VS Code
GitHub Copilot localhost testing is becoming a practical workflow for front-end developers: run the app locally, let Copilot open it in VS Code’s integrated browser, ask the agent to click through real UI paths, inspect screenshots and page text, catch console-visible failures, and turn those findings into focused fixes.
Quick Answer: What Is GitHub Copilot Localhost Testing?
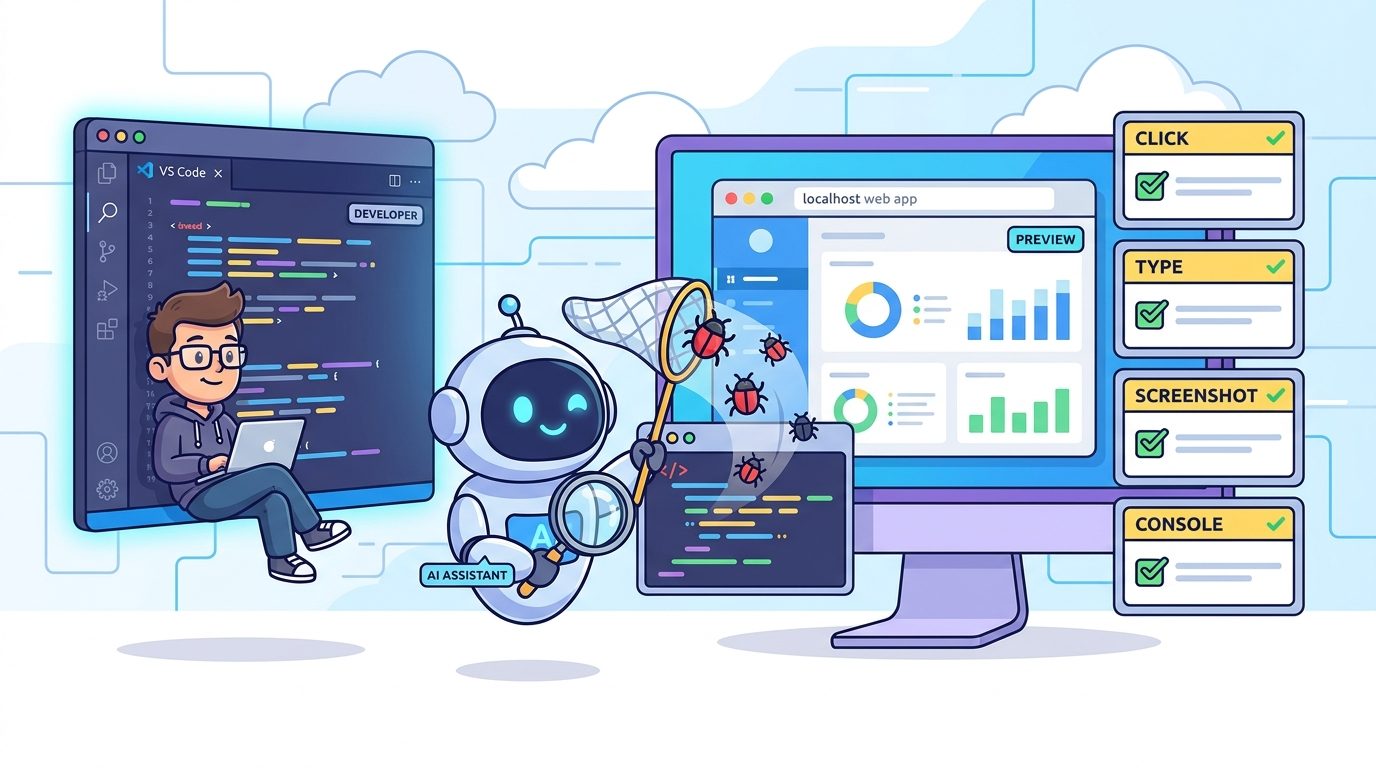
GitHub Copilot localhost testing is the workflow of using GitHub Copilot’s browser-capable agent tools in Visual Studio Code to open and interact with a web application running on your own machine. Instead of only asking Copilot to read source files, you ask it to verify the app the way a user would: navigate to a local URL, read the rendered page, take screenshots, click buttons, hover menus, drag elements, type into forms, handle dialogs, and run browser automation when needed.
This is not a replacement for unit tests, integration tests, accessibility tooling, or a real QA process. It is a faster feedback loop for the bugs that live between code and experience: broken form states, missing validation messages, buttons that look enabled but do nothing, responsive layout regressions, bad redirect behavior, unexpected dialogs, and UI paths that a static code review can miss.
The related pillar article, GitHub Copilot Browser Tools Guide: Test Web Apps Inside VS Code With Agentic Browsing, explains the broader browser-agent feature set. This cluster guide narrows the lens to day-to-day local development: how to test localhost with Copilot without turning the agent into a vague “please test everything” machine.
The important mental shift is that VS Code browser tools let Copilot inspect a live app, not just imagine one from source files. That gives the agent evidence. It can compare expected behavior with actual rendered behavior, use screenshots to reason about layout, read page content to understand state, and interact with controls in sequence. For a solo developer or small team, that makes Copilot web app testing useful before a pull request even exists.
Why Localhost Testing Is a Strong Use Case for Copilot Browser Agent Tools
Most AI coding tools are strongest when the task has a tight loop: observe, change, verify. Localhost web app testing has exactly that shape. Your app is running. The files are open. The failure is visible. The agent can inspect the page, propose a fix, edit code, and test again. That is a better fit than asking a model to guess from a large repository with no runtime evidence.
Official VS Code documentation describes browser agent tools as a way for agents to build and verify web applications in a closed development loop. The agent can create HTML, CSS, and JavaScript, open the app in the integrated browser, interact with it, identify issues through console-visible failures and visual inspection, and fix problems. In practical terms, the strongest pattern is not “Copilot, build my whole app.” It is “Copilot, verify this specific local journey and tell me what breaks.”
Localhost testing also matches the type of content that works for AI Feature Drop readers. Our developer explainers around coding-agent limits, permission models, and practical product workflows get traction because they answer what developers need after the announcement: how to actually use the feature without wasting time, budget, or trust. GitHub Copilot browser tools are interesting because they sit at the intersection of AI agents, IDE ergonomics, testing, and security approvals.
The limitation is equally important: Copilot browser agent tools are only as useful as the scope you give them. If you ask the agent to “test my app,” it may wander through the obvious path and miss the real business logic. If you ask it to “open http://localhost:3000/signup, test empty submission, invalid email, duplicate email, password mismatch, and successful submission using the mock API,” you have given it a checklist that can produce actionable output.
How to Set Up VS Code Browser Tools for Localhost Testing
Before you use test localhost with Copilot prompts, confirm that three pieces are in place: a running web app, Copilot agent mode in VS Code, and browser tools enabled. The VS Code browser-agent testing guide lists a GitHub Copilot subscription and the workbench.browser.enableChatTools setting as prerequisites for browser agent tools.
1. Start your local app first
Run your normal development command in VS Code’s terminal: for example npm run dev, pnpm dev, yarn dev, vite --host 127.0.0.1, python manage.py runserver, or your framework’s equivalent. Wait until the terminal shows the local URL. Typical examples include http://localhost:3000, http://localhost:5173, http://127.0.0.1:8000, or a framework-specific dev server URL.
Do not make Copilot guess the port unless your project is already obvious. Give it the exact URL. This avoids wasted iterations and prevents the agent from testing the wrong page, especially when you have multiple dev servers running.
2. Enable browser agent tools
In VS Code, browser agent tools must be enabled with the workbench.browser.enableChatTools setting. After that, open Chat, choose the agent experience, and use the tools picker to verify that the browser tools are available. VS Code groups the browser tools under built-in browser tooling. The documented tool set includes page navigation tools such as openBrowserPage and navigatePage, page inspection tools such as readPage and screenshotPage, interaction tools such as clickElement, hoverElement, dragElement, typeInPage, and handleDialog, plus runPlaywrightCode for custom automation.
3. Understand session privacy before testing logged-in flows
By default, pages opened by the agent run in private, in-memory sessions. They do not share cookies or storage with your other browser tabs. That default is useful because it limits what browsing data the agent can access. It also means a localhost app that depends on an existing login may appear logged out when the agent opens it.
If you manually open a page in the integrated browser and explicitly share it with the agent, that shared page can use your existing browser session, including cookies and login state. This is powerful for testing authenticated local flows, but it is also a trust boundary. Share the page intentionally, revoke access when finished, and avoid handing the agent a logged-in session for accounts or environments you do not want it to manipulate.
4. Use the integrated browser for local URLs
The VS Code integrated browser can open and interact with web pages directly inside the editor. The integrated browser supports http://, https://, and file:// URLs, and VS Code can open localhost links from places like the terminal or chat when workbench.browser.openLocalhostLinks is enabled. This matters because localhost testing works best when the page, source code, terminal logs, and Copilot chat are all visible in the same workspace.
| Setup item | What to check | Why it matters |
|---|---|---|
| Local dev server | The app is reachable at a known localhost URL. | Copilot needs a real page to inspect, not a guessed route. |
| Browser tools setting | workbench.browser.enableChatTools is enabled. | Without this, the agent cannot use VS Code browser tools. |
| Tools picker | Built-in browser tools are selected for the chat session. | Agents only use tools that are available and allowed. |
| Session model | Agent-opened pages are private by default; shared pages can use your session. | This controls cookies, storage, and login-state expectations. |
| Approval mode | Use a permission level appropriate to the risk of the test. | Browser automation plus file edits should not run with blind trust. |
A Practical Localhost Testing Workflow That Actually Works
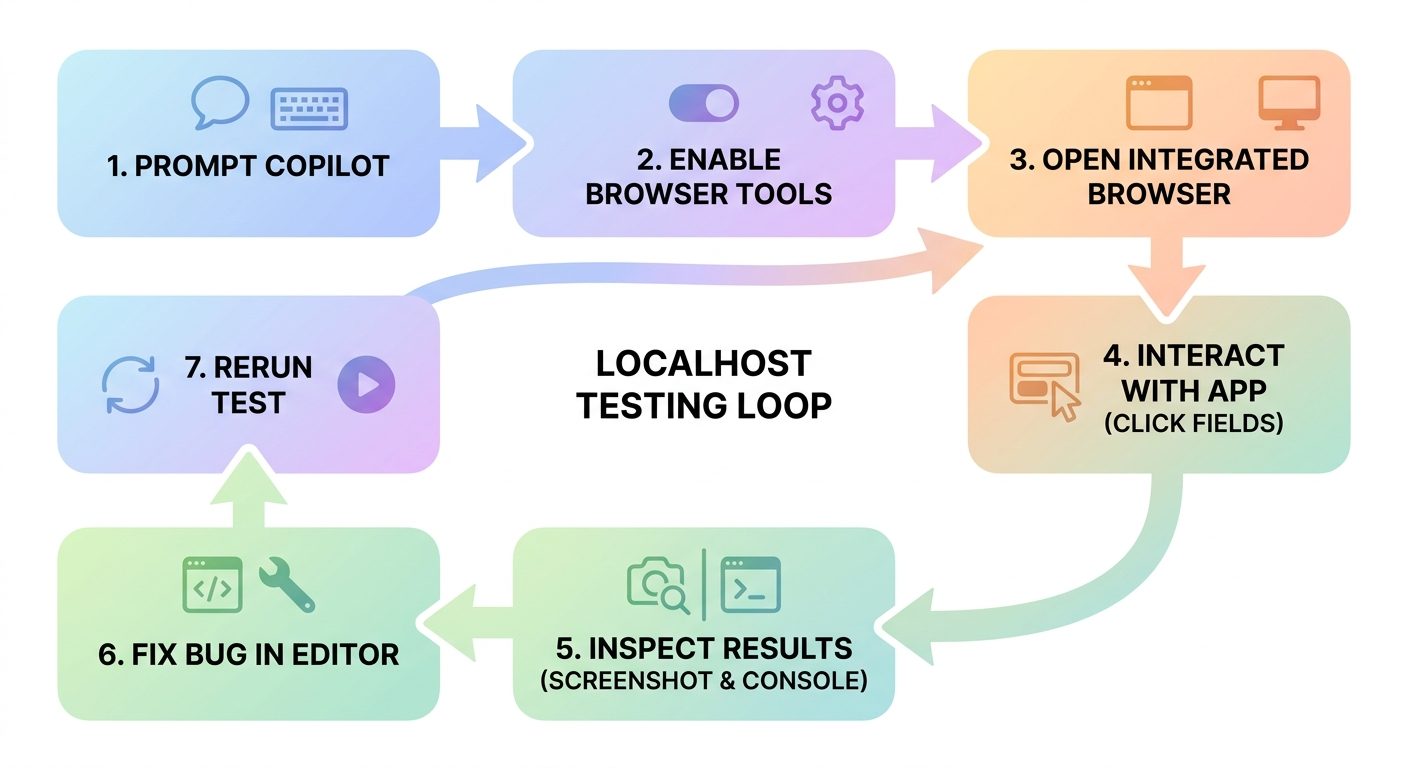
The most reliable workflow is small, explicit, and repeatable. Treat Copilot as a junior QA partner with browser access: give it the route, role, test data, expected behavior, and boundaries. Then ask for a structured report before any fix. This avoids the common AI-agent failure mode where the model edits files before it has proved the bug exists.
Step 1: Define one user journey
Pick a flow that has clear success and failure states. Good first candidates include signup, login, password reset, checkout, dashboard filters, file upload, settings save, modal open/close, mobile navigation, or a multi-step form. Avoid asking for a whole-app audit on the first pass. A narrow flow gives the agent enough room to be thorough.
Open http://localhost:5173/signup in the VS Code integrated browser.
Test this signup flow:
1. Submit the empty form.
2. Enter an invalid email.
3. Enter mismatched passwords.
4. Enter a valid test user.
Report expected result, actual result, any console-visible errors, and the likely component file. Do not edit files yet.
That final sentence matters. “Do not edit files yet” forces observation before modification. It also gives you a chance to reject a weak bug report before the agent touches code.
Step 2: Ask for evidence, not confidence
Do not ask “does it work?” Ask for page text, screenshot observations, reproduction steps, and exact UI behavior. Copilot can read page content and use screenshots, but you still need a report that is easy to verify. The stronger the evidence, the easier it is to decide whether to approve a fix.
For every issue you find, return:
- Route tested
- Interaction sequence
- Expected behavior
- Actual behavior
- Visible text or screenshot observation
- Any console-visible error
- Likely file or component
- Minimal fix recommendation
This format turns Copilot web app testing into a usable QA artifact. Even if the agent’s root-cause guess is wrong, the reproduction steps and actual behavior can still be valuable.
Step 3: Let Copilot fix only one bug at a time
When the agent finds several bugs, choose one. Ask it to make the smallest fix, then retest the same route. This is safer than accepting a multi-file “cleanup” patch that mixes validation, styling, state management, and refactoring. Browser tools are strongest when the agent can verify the exact behavior it just changed.
Fix only the invalid-email validation message bug.
Keep the existing form structure and styling.
After editing, reopen http://localhost:5173/signup and retest only the invalid-email case.
Show the diff summary and whether the bug is fixed.
The keyword is “only.” Localhost testing can become expensive in time and AI credits if the agent repeatedly broadens scope. Keep the loop tight: reproduce, fix, retest, stop.
Step 4: Add a regression test when the bug is real
Once Copilot proves a bug and fixes it, ask for a regression test. Depending on your stack, that might be a component test, unit test, Playwright test, Cypress test, or framework-specific route test. The browser-agent pass is useful because it finds the issue, but a committed test is what prevents the bug from returning.
The fix works in the browser. Now add the smallest regression test for this behavior using our existing test setup. Do not introduce a new testing framework unless there is no existing test framework.
This instruction prevents tool sprawl. A common AI-agent anti-pattern is adding a new package when the repository already has test conventions. Make Copilot inspect the existing test setup first.
Copy-Paste Prompts for GitHub Copilot Localhost Testing
Use these prompts as starting points. Replace the port, route, app details, and test data. The best prompts include both a browser task and a stopping rule.
Smoke test a local page
Open http://localhost:3000 in the integrated browser. Read the page and take a screenshot. Check for obvious rendering problems, broken navigation, missing main content, visible JavaScript errors, and buttons that appear interactive but do nothing. Report findings only; do not edit files yet.
Test a form with validation
Open http://localhost:3000/contact. Test the contact form with empty fields, invalid email, long message text, and a valid mock submission. Verify validation messages are visible and specific. If a dialog appears, handle it and report what it says. Return reproduction steps and likely files before making any changes.
Test a responsive layout
Open http://localhost:5173/pricing. Use browser tools and screenshots to inspect desktop, tablet, and mobile widths. Look for overflowing cards, hidden CTAs, unreadable text, broken menus, and layout shifts. Give a table of viewport, issue, severity, and likely CSS file. Do not edit yet.
Test an authenticated local flow
I will manually open the integrated browser and share the localhost page with the agent so you can use the existing dev login session. After it is shared, test the settings-save flow only. Do not navigate outside localhost. Do not change account-level settings except the test field I name.
Test drag, hover, and interactive state
Open http://localhost:3000/kanban. Test hover states on cards, drag a card from Todo to In Progress, and verify the status text updates without a full page reload. Report if drag does not work, if the state is lost after refresh, or if the UI gives no feedback.
Ask for a minimal fix after evidence
Fix the confirmed bug only. Keep the current architecture. Do not rename unrelated files. After editing, retest the same route in the browser and tell me whether the original reproduction steps now pass.
What Bugs Copilot Browser Tools Are Good at Finding
Copilot browser agent tools are especially useful for bugs that are visible in a rendered page but easy to miss in code review. They are less useful for deep business-logic correctness unless you provide precise expected outcomes and test data. Use the agent for the surface area where browser interaction matters.
| Bug category | Good Copilot localhost testing prompt | What to verify manually |
|---|---|---|
| Form validation | Ask Copilot to submit empty, invalid, boundary, and valid data. | Whether validation rules match product requirements. |
| Navigation | Ask it to click header, footer, sidebar, breadcrumb, and CTA links. | Whether routes require auth or role-based access. |
| Responsive layout | Ask for screenshots at common viewport widths and overflow checks. | Whether visual taste and brand details are acceptable. |
| Modals and dialogs | Ask it to open, close, confirm, cancel, and handle dialogs. | Whether destructive actions need stronger human review. |
| State changes | Ask it to click filters, toggles, tabs, drag targets, and save buttons. | Whether state persists correctly across refresh and sessions. |
| Accessibility basics | Ask for alt text, labels, heading order, keyboard path, and focus visibility. | Use dedicated accessibility tooling for full compliance checks. |
| Console-visible errors | Ask it to report errors that appear during the journey. | Trace logs and stack context in your own dev tools. |
A useful rule: Copilot can help find “this does not behave as expected” bugs; you remain responsible for “this is the correct business expectation.” If the agent does not know your refund policy, pricing rule, role matrix, or compliance requirement, it can only test the generic version of the flow.
Where Playwright MCP Fits in VS Code
The built-in browser tools are not the only browser path inside VS Code. VS Code’s MCP server documentation describes adding Model Context Protocol servers, including the Playwright MCP server, from the Extensions view by searching for @mcp playwright. After installation and trust confirmation, VS Code discovers the server’s tools and makes them available in chat.
Playwright MCP VS Code workflows are useful when you want a more automation-oriented browser testing layer. The built-in browser tools are convenient for integrated browser inspection and agent-driven interaction. Playwright MCP can be valuable when the prompt needs browser automation patterns, repeated actions, selectors, and test-like flows. In practice, many developers will use both: built-in browser tools for fast visual localhost debugging, and Playwright MCP when the workflow should become a more durable browser test.
| Option | Best use | Practical note |
|---|---|---|
| Built-in VS Code browser tools | Open localhost, inspect rendered page, click through a flow, take screenshots, debug visible UI issues. | Enable workbench.browser.enableChatTools and select the tools in the chat tools picker. |
| VS Code integrated browser | Preview local apps, test authentication flows, debug with browser tabs inside the editor. | Localhost links can open in the integrated browser when configured. |
| Playwright MCP | More automation-heavy testing, repeated browser actions, and Playwright-style workflows from chat. | Add it from @mcp playwright, trust the server, and review the tools it exposes. |
| Committed Playwright tests | Regression coverage that runs outside the chat session. | Use Copilot’s findings to create durable tests rather than relying only on an agent run. |
MCP adds another trust boundary. VS Code docs state that on macOS and Linux, sandboxing can be enabled for locally running stdio MCP servers to restrict file system and network access. Sandboxed servers run with explicitly permitted file paths and network domains. The same documentation notes that sandboxing is currently not available on Windows. If you are testing a local app in a business workspace, that detail matters: do not treat MCP servers as harmless just because they are launched from your editor.
For teams, the best standard is simple: install MCP servers deliberately, prefer workspace-reviewed configuration for shared projects, document why the MCP server is needed, and avoid granting broad permissions to tools that can interact with your filesystem, browser, or network unless the benefit is clear.
Approvals, Permissions, and Enterprise Controls
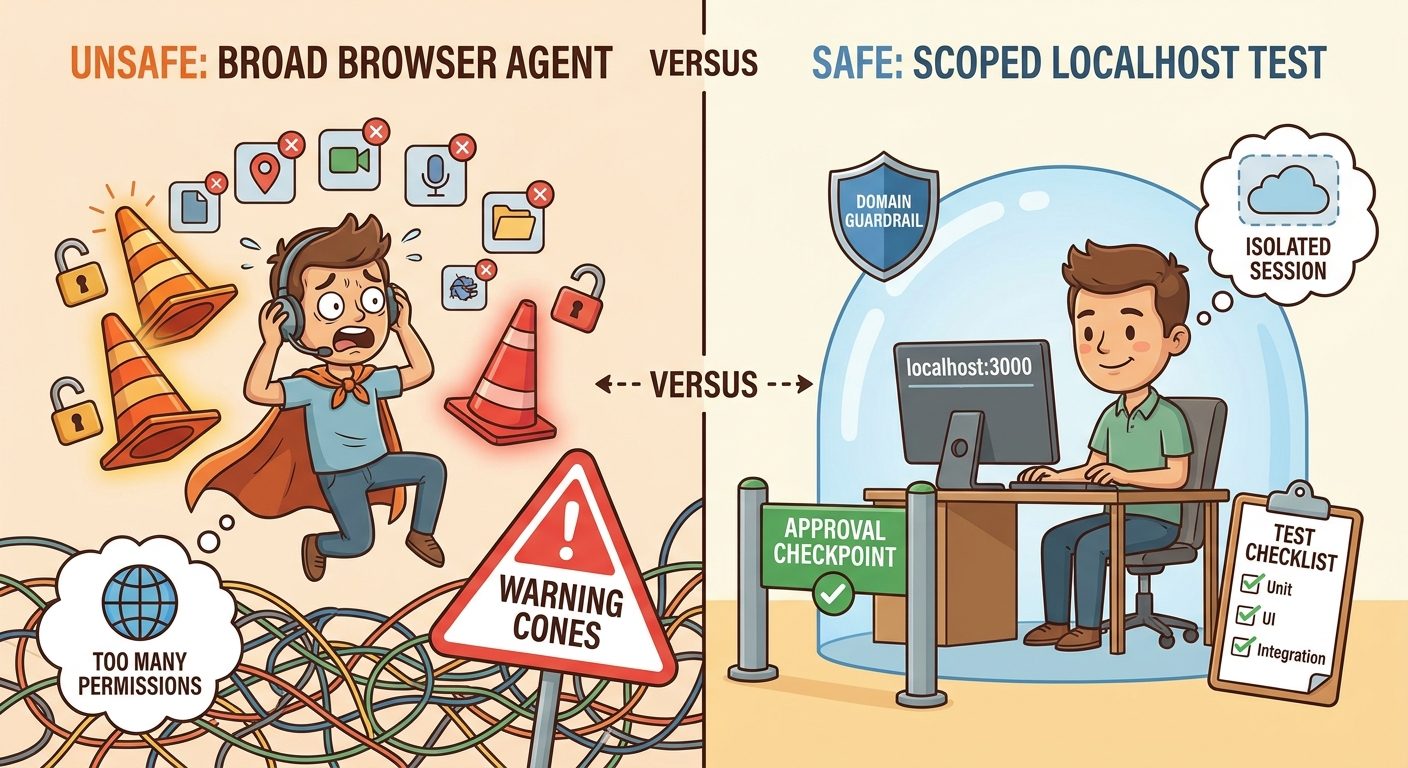
Browser-capable agents are useful because they can act. That is also why approvals matter. VS Code’s approvals documentation explains that agents can run tools and terminal commands, and VS Code asks for approval before actions that modify files, run commands, or access external resources. Permission levels provide the high-level dial for how autonomous the agent can be during a session.
| Permission level | What it means for localhost testing | Recommendation |
|---|---|---|
| Default Approvals | Uses configured approval settings. Tools that require approval show confirmation prompts. | Best default for most local web app testing. |
| Assisted permissions | Experimental option that uses an LLM judge to evaluate risk for tool calls, with prompts for other calls. | Useful only if you understand it is experimental and still review risky actions. |
| Bypass Approvals | Auto-approves all tool calls without confirmation dialogs. | Avoid for unfamiliar repos, sensitive files, or logged-in browser sessions. |
| Autopilot | Auto-approves tools and keeps iterating more autonomously, including auto-retry behavior. | Use cautiously; it can be productive but increases risk and AI credit consumption. |
For Copilot localhost testing, Default Approvals are usually the safest balance. You can let the agent read the page and propose changes while still reviewing tool calls, edits, and commands. Bypass Approvals and Autopilot may feel convenient during rapid prototyping, but they bypass manual prompts for actions that can modify files, run terminal commands, or interact with external tools. That is a meaningful security tradeoff, not just a productivity toggle.
Admins also have controls. VS Code’s browser-agent testing guide notes that administrators can disable browser tools or restrict which domains agent tools can reach with enterprise policies. That is important for organizations that want Copilot browser tools on localhost but do not want agents browsing arbitrary external domains, touching production dashboards, or interacting with internal systems beyond approved development environments.
localhost, preview deployments, and documented staging domains; require approval for production domains; restrict unknown external domains; and keep Autopilot disabled for repositories with secrets, payments, compliance workflows, or customer data.Example: Testing a Local Checkout Flow With Copilot
Imagine you are building a small ecommerce checkout flow at http://localhost:3000/checkout. The code compiles, but you are not confident about the user journey. This is a strong Copilot browser tools use case because checkout involves visible UI state, validation, async behavior, dialogs, error messages, and route changes.
Pass 1: observation only
Open http://localhost:3000/checkout in the integrated browser.
Test the checkout page as a first-time user:
- Try submitting with an empty cart.
- Add one item if the UI allows it.
- Submit with missing shipping fields.
- Enter an invalid postal code.
- Enter valid mock shipping data.
- Stop before any real payment action.
Report issues in a table. Do not edit files.
A good report might say that the empty cart state allows the checkout button to remain enabled, the postal code error appears only after two submissions, or the shipping form loses state when the delivery method changes. Those are exactly the practical bugs that can slip past a code-only review.
Pass 2: minimal fix
Fix only the empty-cart checkout button issue.
Expected behavior: if cart item count is zero, the checkout submit button is disabled and shows helper text explaining that the cart is empty.
Do not change payment logic. Retest the empty-cart case after editing.
This keeps the agent away from payment logic and limits the file diff. If it tries to modify unrelated files, reject the change and restate the boundary.
Pass 3: regression test
Add a regression test using the existing test framework that verifies the checkout submit button is disabled when the cart is empty. If there is no existing browser test setup, propose the test file and commands first instead of installing packages.
This is the point where Copilot browser tools become more than a demo. The agent has observed the UI, fixed a specific bug, verified the fix, and helped convert that behavior into a repeatable test.
GitHub Copilot Localhost Testing Checklist
- Scope Pick one route or user journey, not the whole app.
- URL Give Copilot the exact localhost URL and port.
- Tools Enable
workbench.browser.enableChatToolsand select browser tools in the tools picker. - Session Decide whether the agent should use a private in-memory page or a manually shared page with existing cookies.
- Safety Use Default Approvals unless you have a strong reason to do otherwise.
- Data Use mock users, local databases, seeded test data, and disposable accounts.
- Evidence Ask for actual behavior, expected behavior, screenshot observations, and reproduction steps.
- Fix Approve one minimal fix at a time; avoid broad refactors during test passes.
- Retest Ask Copilot to rerun the original reproduction steps after editing.
- Regression Convert confirmed bugs into tests with your existing framework.
- Policy For teams, restrict domains and MCP access through enterprise settings where appropriate.
- Stop rule End the session when the target flow passes; do not let the agent keep exploring indefinitely.
Common Mistakes to Avoid
Do this
- Ask Copilot to test one route and one user story at a time.
- Use the integrated browser for local links and visible app state.
- Keep browser sessions private unless login state is required.
- Review tool calls, file edits, terminal commands, and MCP tools.
- Use Playwright MCP when the workflow needs repeatable automation.
- Turn successful bug reproductions into committed regression tests.
Avoid this
- Do not ask the agent to “test everything” without a checklist.
- Do not share logged-in sessions casually.
- Do not use production data for local browser-agent experiments.
- Do not enable Bypass Approvals or Autopilot just to avoid reading prompts.
- Do not install new test frameworks without checking the existing repo setup.
- Do not accept broad refactors when you only asked for a browser bug fix.
The difference between a useful Copilot testing session and a frustrating one is usually not the model. It is the workflow. A narrow route, strong expected behavior, controlled approvals, and a clear stop rule make Copilot browser agent tools feel like a practical developer feature rather than a flashy demo.
Related AI Feature Drop Guides
- GitHub Copilot Browser Tools Guide: Test Web Apps Inside VS Code With Agentic Browsing — the pillar guide for the broader browser tools feature set.
- GitHub Copilot AI Credits Explained — understand usage patterns before long agent sessions.
- OpenAI Codex Pricing and Usage Limits — compare coding-agent cost and limit habits.
- Claude Code Usage Limits Explained — related guidance for agentic coding constraints.
- How to Reduce Claude Code Usage — workflow habits that also help with Copilot agent sessions.
- OpenAI AgentKit Guide — agent workflow and tool-governance patterns.
Sources and References
- VS Code: Build and test web apps with browser agent tools
- VS Code: Integrated browser documentation
- VS Code: Add and manage MCP servers
- VS Code: Manage approvals and permissions
- GitHub Changelog
Product behavior, settings, and enterprise controls can change. Verify the current VS Code and GitHub Copilot documentation before setting team policy or relying on a specific preview feature.
FAQ: GitHub Copilot Localhost Testing
Can GitHub Copilot test a localhost web app inside VS Code?
Yes. With browser agent tools enabled, Copilot can open and interact with pages in VS Code’s integrated browser, including local development URLs such as http://localhost:3000 or http://localhost:5173.
Which setting enables VS Code browser tools for Copilot?
The VS Code browser-agent testing guide lists workbench.browser.enableChatTools as the setting required for browser agent tools. You also need to enable the browser tools in the chat tools picker for the session.
Do Copilot browser tools share my cookies by default?
No. Pages opened by the agent use private, in-memory sessions by default and do not share cookies or storage with your other browser tabs. If you manually share an integrated browser page with the agent, that shared page can use your existing browser session and cookies.
What browser actions can Copilot perform?
VS Code documentation lists tools for opening and navigating pages, reading page content, taking screenshots, clicking, hovering, dragging, typing, handling dialogs, and running Playwright code.
Should I use Playwright MCP or built-in browser tools?
Use built-in browser tools for fast local visual testing and page interaction inside VS Code. Use Playwright MCP when you want more automation-oriented browser workflows or when a Copilot-discovered bug should become a durable browser test.
Is MCP sandboxing available on every operating system?
No. VS Code documentation says sandboxing for locally running stdio MCP servers is available on macOS and Linux, and is currently not available on Windows.
Which approval level is safest for local browser testing?
Default Approvals are the safest default for most developers because tool calls that require approval still show confirmation prompts. Bypass Approvals and Autopilot can be convenient but carry stronger security cautions.
Can admins restrict Copilot browser tools?
Yes. VS Code documentation notes that administrators can disable browser tools or restrict which domains agent tools can reach with enterprise policies.
Can Copilot replace QA or automated tests?
No. Copilot browser tools are best used as a fast local feedback loop. Confirmed bugs should still become regression tests, and critical workflows still need human review and proper QA coverage.
Post a Comment